Blog
Visualising Time: Comparing discrepancies in witness statements
The principal output of this project will be our open access website - complete with GIS maps and digital edition. However, in order to link the two, a number of connections have to be made between the text and the physical space in which the events described took place. One way of doing this is through the ide.jpgication of certain ‘narrative nodules’, events referred to in the various testimonies which can both provide a link between the various accounts of events, and tie them to the city of Swansea itself.
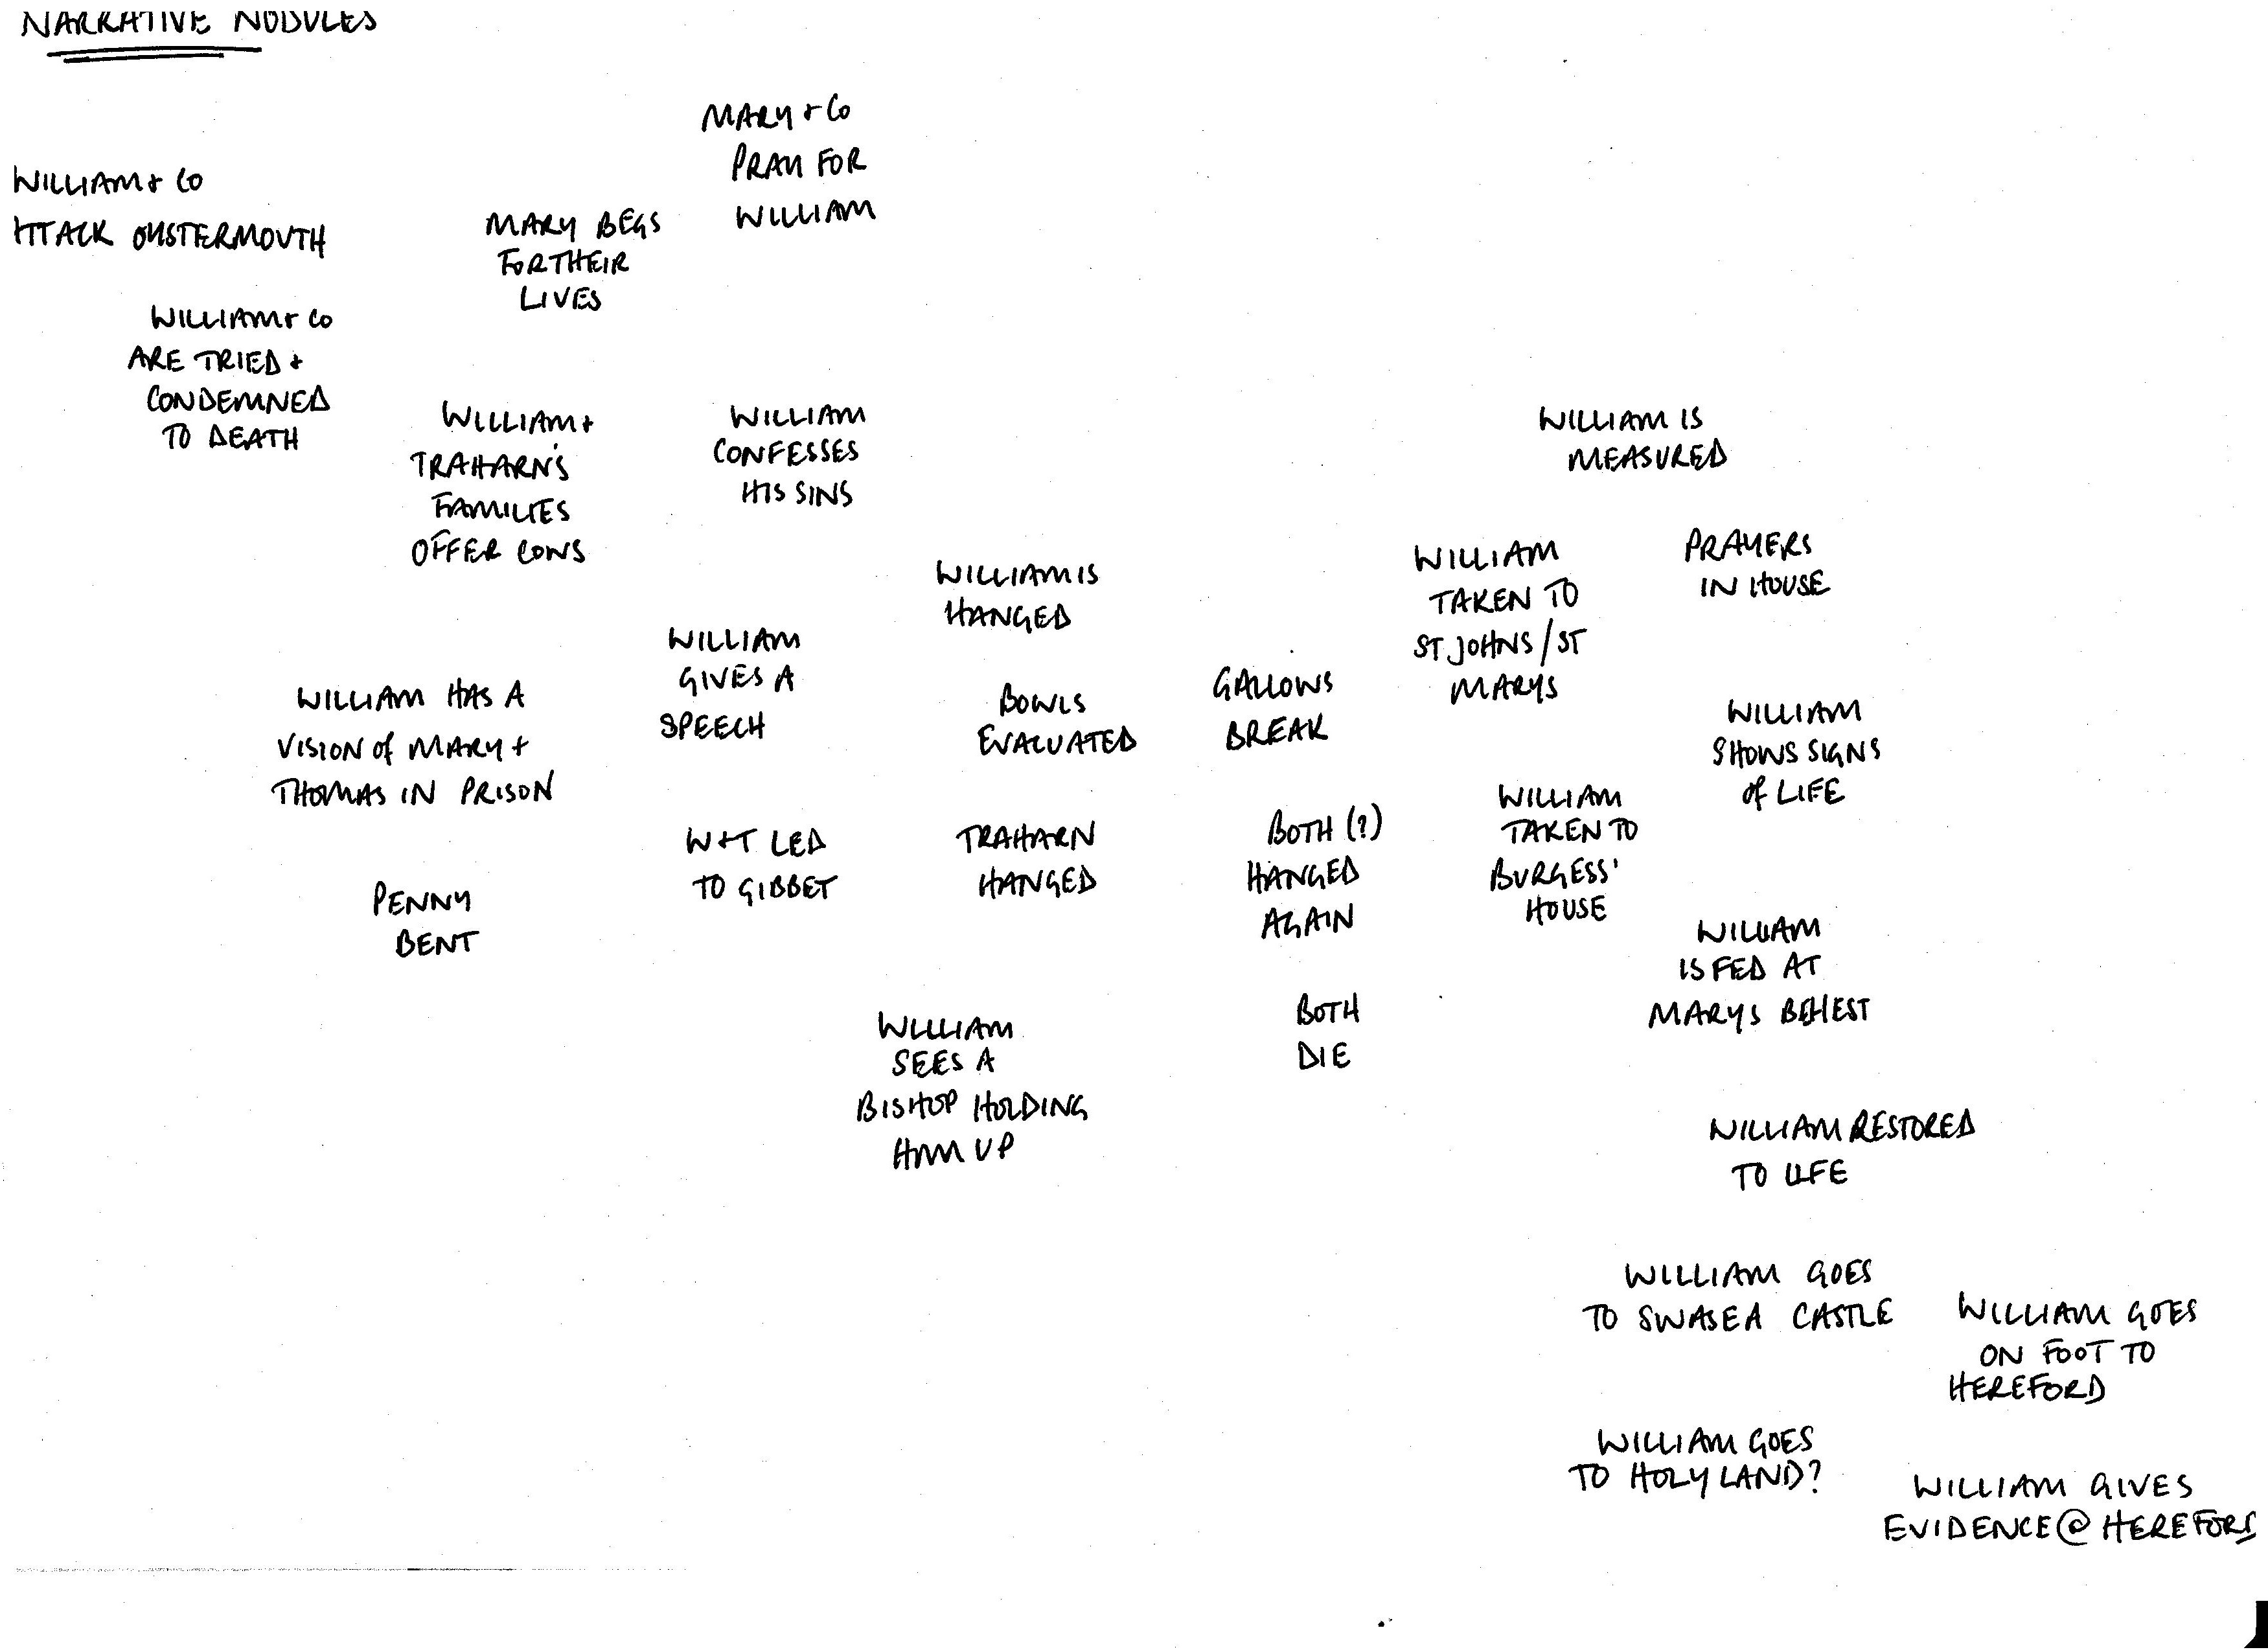
My first attempt at this was a linear schematic centred around William Cragh. This made logical sense in that the witnesses were only called because of William and what happened to him, and thus their versions of events necessarily relate back to him constantly. Also, it suited the structure of the questioning process, as the interrogators were intensely interested in what time of day things occurred.
However, this did not work as well as I had hoped. The focus on William grossly over simplified events, and omitted a number of key ‘nodules’ in which he was not actually involved. Secondly, the discrepancies between witnesses as to what time fundamental moments such as the hanging itself took place made a strictly linear approach problematic.
As a consequence, my second attempt looks more like a scatter diagram of ‘narrative nodules’ with a broad overall movement in time from top left to bottom right of the page. Events which are reported to have occurred at different times by different witnesses can be more easily incorporated into the overall flow of time by being placed further out on the periphery. You can see the result at the top of this blog page. What do you think?
However, the visualisation of time does not end there! It will be really useful for users of the site to be able to compare different witness’s versions of events quickly and visually, without having to read through their convoluted statements and decipher the references to medieval times of day themselves. So while these narrative nodules are a useful tool in constructing the website’s ontology, the actual representation of time will have to be quite different.
We are still discussing what this might look like and how it will function, but the general idea will be to have something a little like this:
Essentially, there will be one timeline, stretching from the attack on Oystermouth Castle and the capture of William and Traharn, through to William’s recuperation and pilgrimage to Hereford Cathedral. Each event will be represented by a block of colour, and each witness will have their own horizontal line under the principal timeline. Then each event according to each witness can be plotted against the master timeline.
The result will be that at a glance, it will be possible to see the variance say in the length of time each witness said it took for William to regain consciousness, as this stage in the narrative would be shown as a blue block of varying lengths: instantly apparent visually.
What I want to avoid, however, is over complicating things and ending up with something like this!